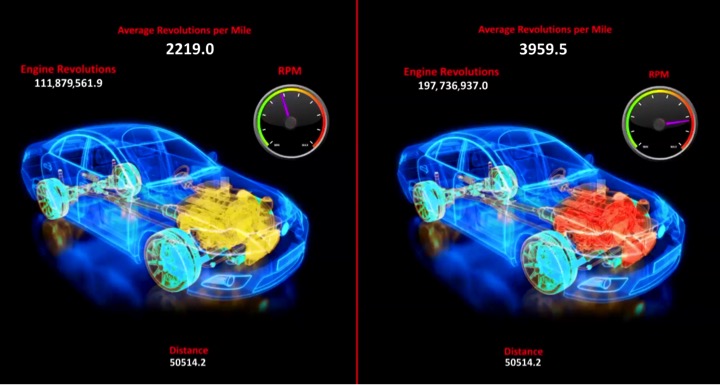
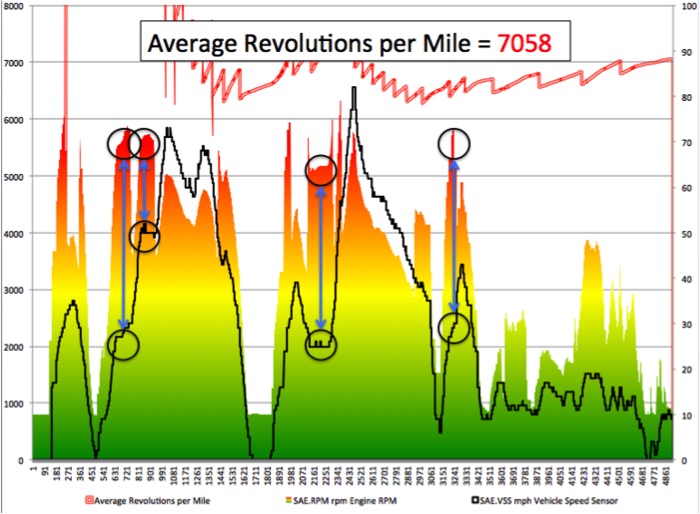
ARM – Average Engine Revolutions per Mile
Total Engine Revolutions
divided by
Total Distance Traveled
Example 1 – Normal Driving
| Average Revolutions per Mile = 1943 | Engine Revolutions displayed | Vehicle Speed displayed |
|---|---|---|
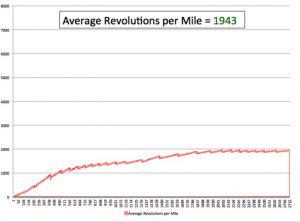 |
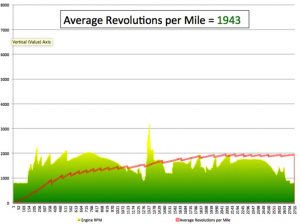 |
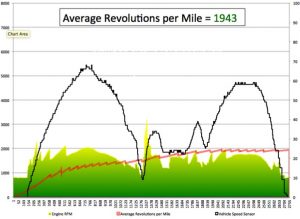 |
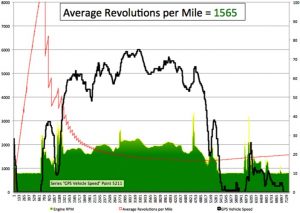
Example 2 – Idling for long periods – Normal ARM
| Sitting at idle for long periods of time does create extra ARM, but averages out quickly with normal driving | ||
|---|---|---|
 |
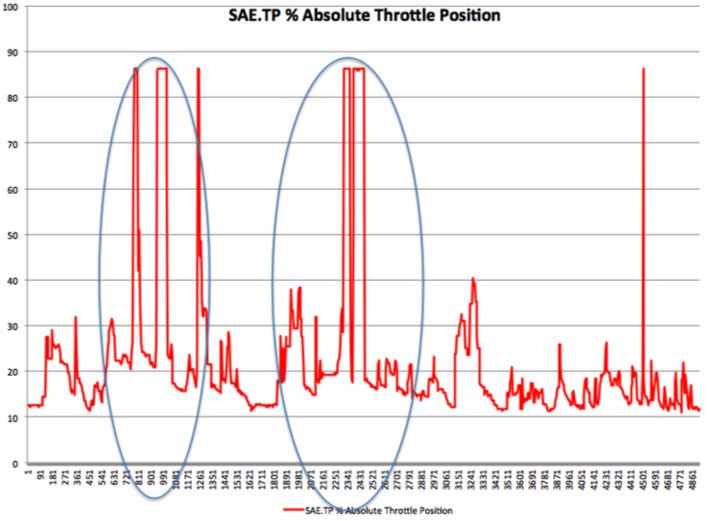
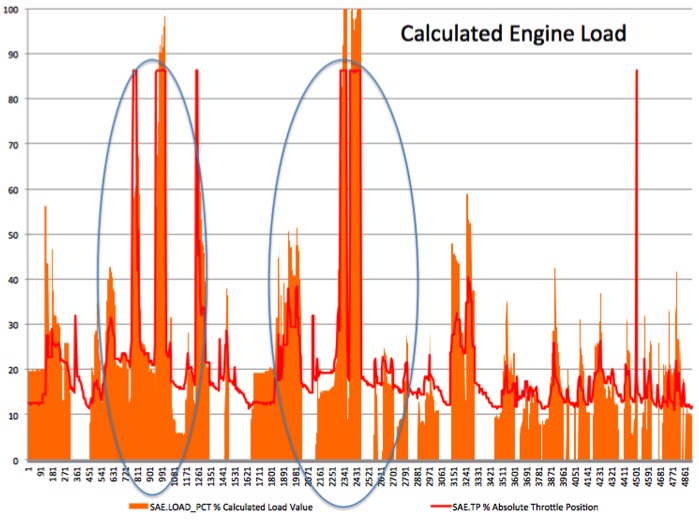
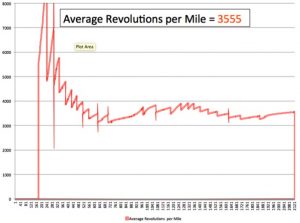
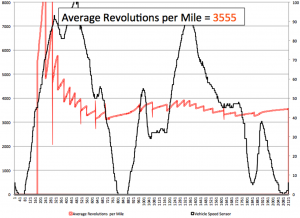
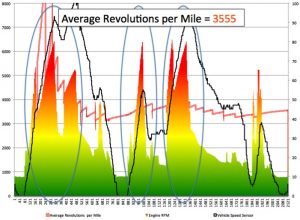
Example 3 – Higher than normal ARM – Racing/Spikes in Engine Revolution History
| Higher than normal “Average Revolutions per Mile” = 3555 | Speed Spikes indicate “RACING” | Time Stamped Engine Revolutions verify “racing spikes” AND periods of Engine RED LINE |
|---|---|---|
 |
 |
 |
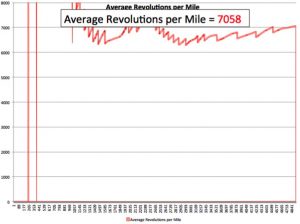
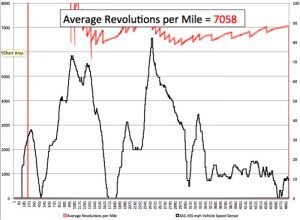
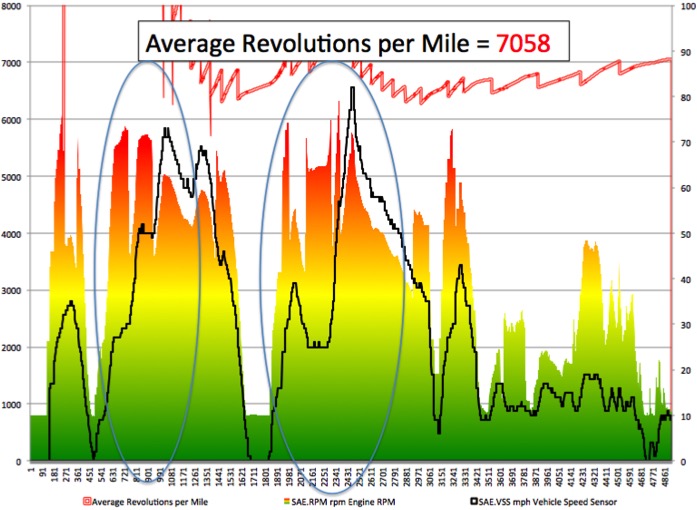
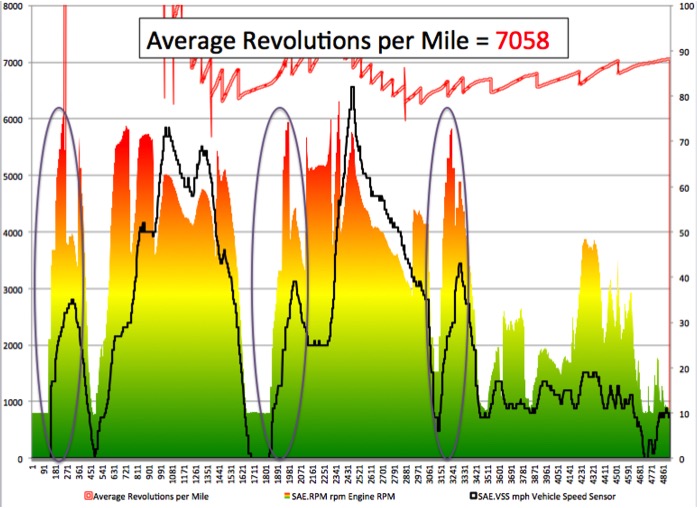
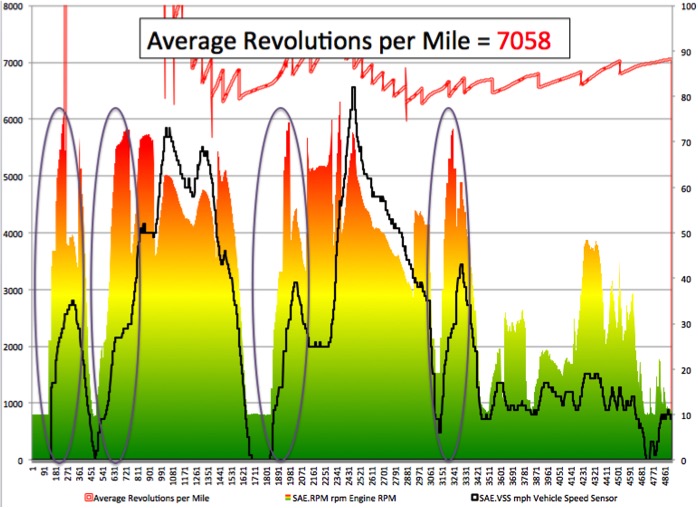
Example 4 – EXTREME ARM – ENGINE & TRANSMISSION ABUSE!
The operator of this vehicle was trying to destroy the Engine & Transmission!
Companies no longer have to be victim to Driver Negligence and Engine/Transmission abuse. Multiple Utility and Business Method Patents allow a negligent operator to be identified and make them liable for the extra wear and tear.
| COMPLETE ENGINE HISTORY | DRIVING PATTERN RECOGNITION | NEGLIGENCE / ABUSE DETECTION |
|---|---|---|
 |
 |
 |
| ACCURATE ROAD CHARGE & TAXES | PRECISION DRIVER RISK RATINGS | ODOMETER FRAUD PREVENTION |
 |
 |
 |

