
Who is checking AI?
Artificial Intelligence – “AI” is a common buzz term today but is “AI” really intelligent, and who is checking? AI is everywhere now so it is very important that it’s correct, but it is evident companies have no clue how to track what a vehicle is really doing, much less the driver. Without mentioning the name of the company, I’m going to show some bad “AI”.
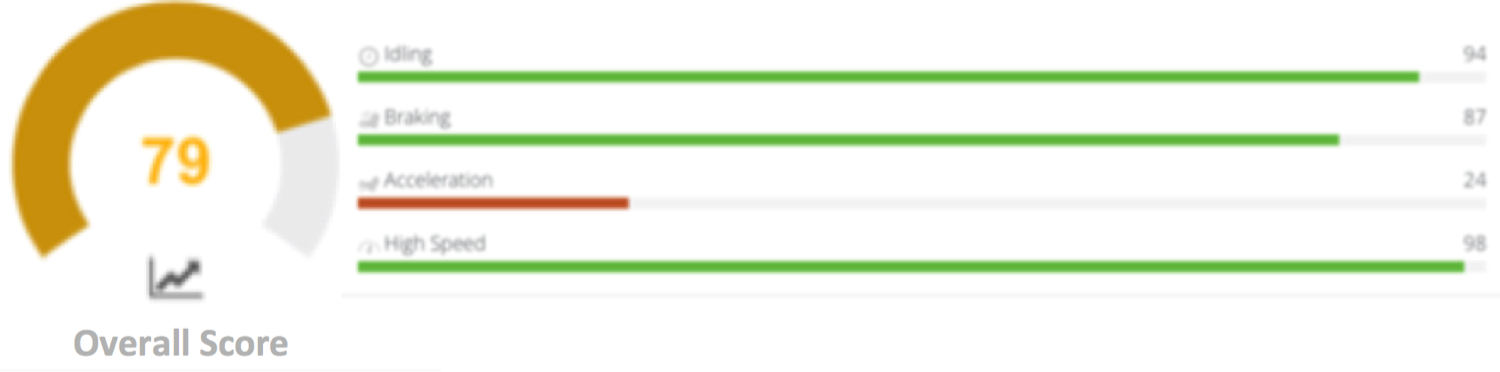
While testing one fleet tracking system, after a couple of weeks I logged into the website and noticed a 79 overall driver score. For those of you that know me probably think that is about right, however this was my wife’s car. My wife doesn’t go very far or very fast. Most of her driving is taking our kids to and from school. A breakdown of driving score looks to have averaged in mid 90s if not for Acceleration being 24!
Having a hard time believing my wife drives like this with the kids, I went with her to pick up my daughter. Upon returning home I went back on the website and sure enough, 4 more events, lowering the score further. Now I know something is wrong.
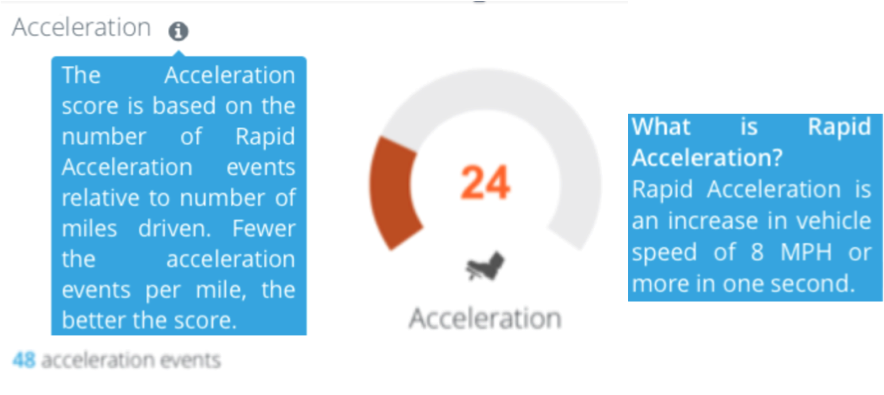
My daughter’s school is 2 miles away and my wife drove completely normal. Deciding to look at events closer, I found out this particular company uses an algorithm that calculates an “Acceleration Score” based on the number of “Rapid Acceleration Events” relative to the Miles traveled. A “Rapid Acceleration Event” is an 8mph increase in vehicle speed in 1 second. The fewer the acceleration events, the better the score. This probably sounds like it makes sense, but I want to point out that it leverages nothing related to the vehicle or what is happening inside the vehicle so it is always an assumption. This method has numerous real-life situations in which it will be incorrect such as downhill driving, highway onramps and highly congested roads creating stop and go traffic which will all absolutely trigger this.
Braking is another metric used to determine driver score and again, the algorithm is to use the number of braking events relative to the distance traveled. A “Hard Braking Event” is braking 8mph in one second. The problem is you never know why someone is braking. Is it a stop sign or sudden red light? Did a car cut you off? Bumper to bumper traffic will just kill your score. What if kid runs in front of your car? Should your driver score be penalized because you saved a child’s life? This is just a few of the possibilities where these assumptions can and will be inaccurate.
What made my wife’s score go down? Long lines of cars, kids crossing streets, crossing guards telling 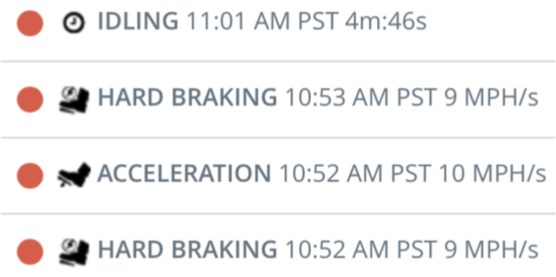 who to go when… That’s it! You can see by the list… 4 more events recorded in just 9 minutes. 3 events in 1 minute! Then penalizing her again as we sat in a line of cars waiting to pick up kids outside the school for 4 minutes. This time she received 2 events for braking and 1 for acceleration, but when it comes to stop and go traffic, it could be one or the other, or both like what happened to my wife.
This major problem is becoming a trend. Companies are applying bad algorithms to determine something they can not make any sense out of just to say they have “AI”. We do not want incorrect driver ratings due to flawed algorithms which someday WILL affect our insurance rates.
It is hard to determine accurate driver ratings with only a portion of data. What we need is specific information such as engine RPM. If we could detect high engine RPM before or during acceleration and braking, it would provide a better determining factor that the driver was being negligent because high engine RPM is a direct result of the drivers actions and therefore a valid way to establish driver ratings.
Unfortunately tracking engine RPM is hard and can lead to inconclusive results. Averaging a vehicle’s RPM also doesn’t provide accurate data. For example: If a driver takes a vehicle to the racetrack and races for 15 minutes at 6000 RPM, then lets the vehicle idle for 45 minutes, average RPM will correspond to 2000 RPM – completely hiding the racing abuse the engine has just endured.
The trick is to divide the engine revolutions by distance traveled. Using this method, if 2 cars travel 100 miles, one at 6000 RPM, and the other at 1500 RPM, it becomes easy to see one has extra wear. More importantly, we can validate it was from negligent driving because not only is the “Average Engine Revolutions per Mile” higher than normal, but we can see the RPM history, and can validate throttle position and engine load, all of which represent exactly how a driver was operating a vehicle so an accurate driver rating can be applied. GPS recordings make easy to validate uphill and downhill driving. This method also makes it easy to see burnouts, drop shifting, down shifting, red-lining, revving in neutral and more! These trends can be calculated over time creating a true driver rating.
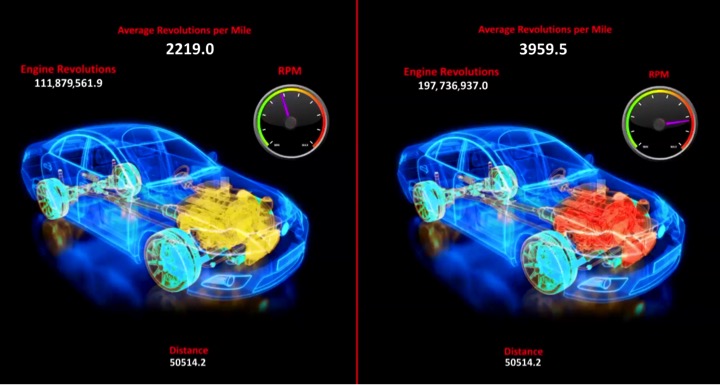
The best thing about using this method is the result is a very simple to understand number. Under 2000 is typically good, over 3000 is typically not good. This number not only represents the driver, but also the vehicle ending odometer fraud. If the odometer is rolled back, not only would it be detected immediately, but it also raises the ratio of engine revolutions to distance traveled, making “Average Engine Revolutions per Mile” larger than before. Roll the mileage back by half and “Average Engine Revolutions per Mile” doubles.
In the case of my wife, vehicle speed never went over 35 MPH, and RPM never went over 2000 (not that they were tracking). This system would have recognized my wife was in stop and go driving, and no acceleration or braking events would have occured.
Learn more about Driver Profiling & Risk Ratings: https://kenometer.com.
Written by Ken Winiecki
Tuesday Jan. 16, 2018